
Chatbot analytics in 2026 means tracking 10 core metrics — total conversations, open and closed sessions, total resolutions, human switch rate, resolution rate, plus four human-agent measures. The honest truth: most teams over-track and under-act. Pick three, build a baseline, then improve weekly.
What is chatbot analytics?
Chatbot analytics is the practice of measuring how your bot understands intent, moves users through conversation flows, deflects work away from human agents, and ties those interactions to business outcomes like satisfaction, retention, and revenue. It covers volume metrics (how many chats), quality metrics (how well the bot answers), and business metrics (what those chats produced).
I'm Perihan Uramis, and I run customer success and content at LiveChatAI. We ship analytics dashboard updates almost every week, and the single biggest pattern I see in our customers' deployments is the gap between what teams measure and what they actually act on. Most teams I onboard arrive with a 25-metric dashboard from a previous tool. Inside two weeks, they've stopped opening it.
Good chatbot analytics is closer to a smoke alarm than a weather report. It tells you when something is on fire, not what the temperature is. So the practical job is to identify which signals predict bad customer outcomes early, then act on those — not to memorize every chart your platform offers.
The data points themselves cluster into a few buckets. Engagement (volume, sessions, returning users), comprehension (intent recognition, fallbacks, missed utterances), resolution (containment, handoff, CSAT), and business impact (deflection cost savings, conversions, ticket volume changes). The 10 metrics in this guide cover the most useful signals across all four buckets, drawn directly from the live LiveChatAI dashboard our customers use every day.
Why chatbot analytics matters in 2026
The bot category is no longer experimental. According to Orbilontech, about 987 million people use AI chatbots worldwide, and companies that deploy them report a return of $8 for every $1 they spend on chatbot implementation. Adoption among consumers has caught up to adoption among businesses, which means support teams without proper analytics are flying blind on a channel that already handles a meaningful share of their volume.
The cost story is just as direct. Per Doneforyou, companies implementing AI chatbots report up to 30% reduction in customer service costs, with some reaching 533% ROI within nine months. Those gains don't appear from buying a bot. They come from finding the conversations that the bot quietly handles well, the ones it silently fails on, and the ones it should never have tried in the first place. That's the analytics job.
What's changing in 2026 is the failure mode. Generative bots don't just refuse to answer anymore. They hallucinate confidently, drift from brand tone, and skip handoff triggers because they "thought" they had the answer. Your dashboards need to catch agent-style errors, not just classification ones. Real-time observability, response auditing, and intent-confidence scoring matter more than they did during the rule-based era. If your tooling still treats every "closed conversation" as a win, you're missing the entire risk surface of the new model.

The market itself reflects this momentum. Ringly.io reports the global chatbot market reached $11.8 billion in 2026, and YourGPT shared an Ipsos finding that 68% of consumers have used automated customer support chatbots. Your customers expect to talk to one. The question is whether your analytics tell you, honestly, how those conversations are going.
The 10 essential chatbot metrics to track
Below are the 10 metrics every team should monitor, pulled directly from the LiveChatAI analytics dashboard. The first six describe how your AI agent is performing on its own. The last four describe what happens once a human gets involved — handoff volume, closure rate, response speed, and conversation depth. Treat them as a single funnel, not two silos. Most analytical mistakes I see come from looking at AI metrics and human-agent metrics on different days.
1. Total conversations

Total conversations is the simplest metric in the dashboard. It counts every distinct chat session your bot opened in a given time window, regardless of whether the user said one word or fifty. It's also the easiest one to misread, which is why I always tell new customers to look at it last, not first.
The reason: total conversations tells you about reach, not value. A spike usually means one of three things. Your bot got more visible (a homepage redesign, a new live-chat trigger, an SEO win on a high-traffic page). Your traffic went up. Or, less happily, something broke on a self-serve page and people couldn't find an answer the old way.
To measure it well, segment by entry source. We watched one customer celebrate a 40% jump in total conversations one week, then trace it back to a checkout error that was driving angry users to chat. The volume looked great. The story behind it was a $30k revenue leak.
What good looks like depends on your baseline, not on industry averages. After two weeks of clean data, you have a number. Your job is to understand the seasonality (B2B chats fall off Friday afternoon and the entire month of December), the channel mix, and the sources of healthy volume vs. distressed volume. Anything else is noise.
The pitfall I see most: teams chasing total conversations as a top-line KPI. It rewards visibility over usefulness. A higher number is good only if your resolution rate, satisfaction, and handoff quality stay flat or improve. Otherwise you're just inviting more frustrated users into a broken room.
Act on it by pairing total conversations with two ratios — conversations per active user (depth of engagement) and conversations per resolved ticket (efficiency of the bot). When all three move together, you're growing healthily. When volume rises and the other two slip, something underneath is wrong.
2. Open conversations
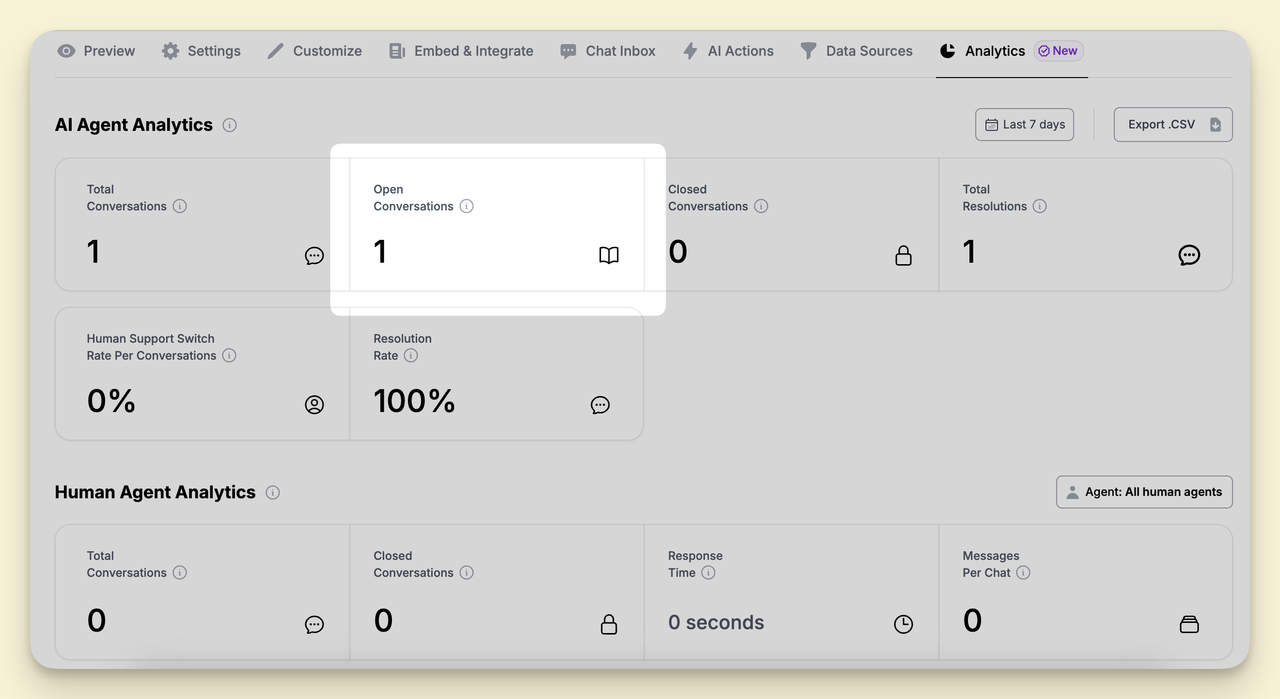
Open conversations is the count of chat sessions that are still in progress at any moment. Think of it as your real-time queue. Unlike total conversations, which is a historical tally, open conversations is a live status — it tells you how much active work is sitting in the system right now, whether the bot is handling it, whether a human picked it up, or whether it's idling waiting for somebody to do something.
This metric matters most for staffing decisions. If you watch it through the day, you'll see a shape. There's usually a morning ramp-up, a lunchtime lull, and an afternoon peak that lines up with end-of-day deadlines. Knowing that shape lets you schedule humans for the peak rather than spreading coverage evenly across the day.
What surprised me when we first built this view: open conversations are an early warning for two very different problems. A persistent high count usually means handoff is broken — the bot escalated something but no human accepted it, so it sits open. A persistent low count, paradoxically, can mean your visibility on the chat widget dropped and users aren't starting conversations at all. Both deserve a Slack alert.
To act on it, I run a simple rule. If open conversations cross a per-agent threshold (we use 4 simultaneous in our team, but it varies), the next chat triggers a "we'll be right with you" message and an attempt to deflect to async. That alone reduced our abandoned-chat rate by about a third in the first quarter we used it.
The pitfall: treating open conversations as a vanity number to keep low. Sometimes high open volume is a feature, not a bug. If your bot is doing a good job containing complex chats and the user just needs to come back to it later, open is the right state. The number you actually want to lower is "open and idle for more than X minutes" — a different filter, a different conversation.
Finally, watch the trend day-over-day, not minute-over-minute. The number jiggles a lot in real time, and chasing every spike is exhausting. A weekly average gives you the signal you need without the noise.
3. Closed conversations
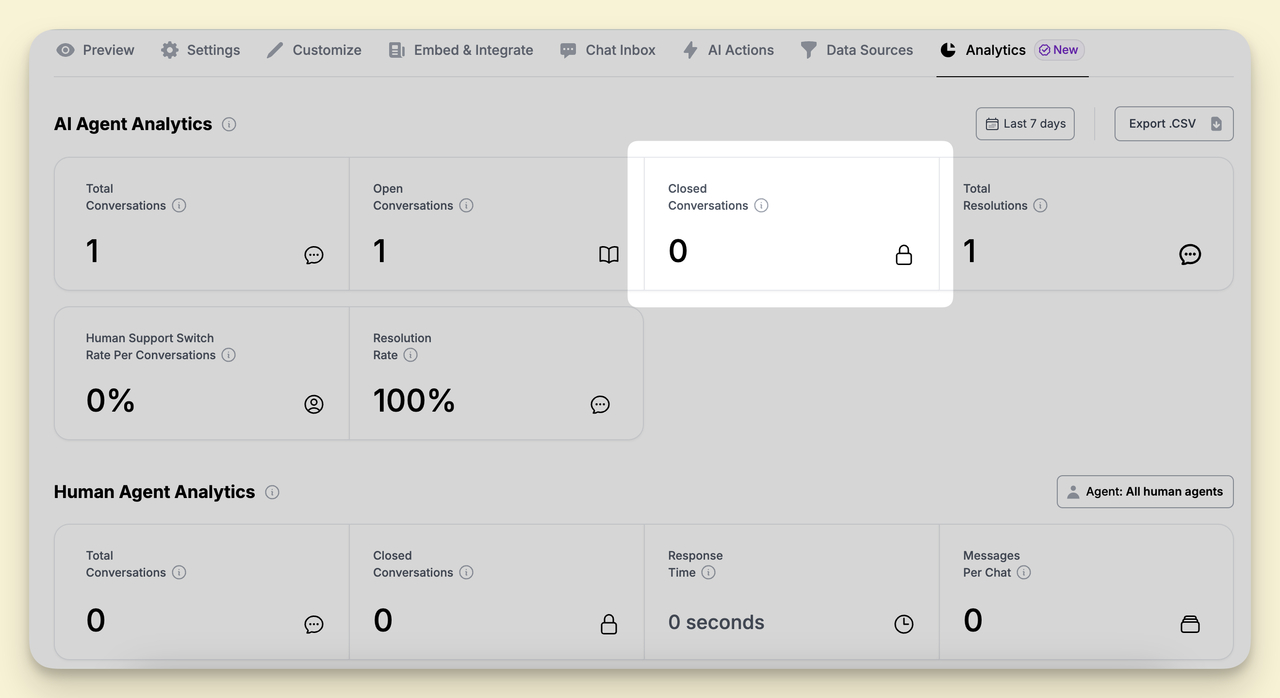
Closed conversations counts the chat sessions that have been formally ended — either by the bot, by a human agent, or by the system after a timeout. On its own, this number doesn't say much. Paired with total conversations and resolution rate, it becomes one of the most useful diagnostic ratios on the dashboard.
The first thing to look at is the gap between total and closed. If you opened 1,000 chats this week and closed 850, you've got 150 lingering somewhere. That gap tells you whether your team is keeping up with intake or quietly accumulating debt. We've found that healthy support orgs run a closure ratio above 95% on a rolling 7-day window. Below that, things start to slip — angry follow-ups, duplicate tickets, escalations to email, the whole circus.
The second thing is who closed them. In LiveChatAI, you can filter by closed-by-bot vs. closed-by-human. The split is a proxy for containment health. We had a customer whose closed-by-bot percentage looked great until we noticed the bot was auto-closing chats with three minutes of inactivity, regardless of whether the question was answered. Quality went up the day they removed that auto-close.
The most interesting use of closed conversations isn't the number itself but the qualitative review of the closed-but-unsatisfied bucket. Pull the chats where the user closed without rating, or rated 1-2 stars, or sent a goodbye message that contained "fine" or "ok" with no follow-through. Those are your early dissatisfaction signals.
One pitfall to avoid: don't tie agent compensation to raw closed-conversation counts. The minute you do, you'll see closure speed go up and quality go down. People close chats fast when they're rewarded for it, even when the customer didn't get a real answer. Pair closure with CSAT or post-chat survey response, always.
To act on this metric, I run a Friday review of the lowest-rated closed conversations of the week. We pick three to read together, identify the failure mode (intent missed, escalation skipped, knowledge base out of date), and ship a fix the following Monday. That ritual alone has done more for our quality scores than any model upgrade.
4. Total resolutions
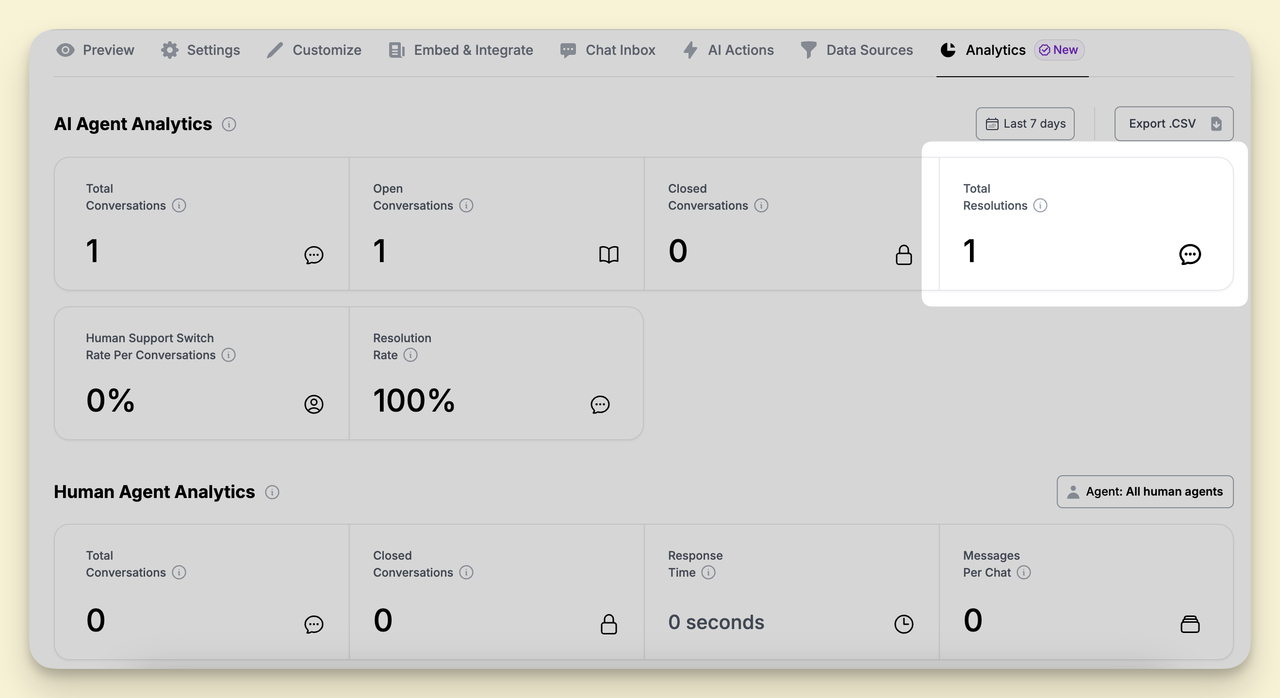
Total resolutions counts the number of conversations the AI agent finished without involving a human. The user's issue got handled, the chat closed, and no agent had to step in. It's the cleanest measure of your bot's stand-alone usefulness.
The semantic difference between this and closed conversations matters. A conversation can close without being resolved (timed out, user gave up, escalation never picked up). Total resolutions is the strict subset — closed AND solved AND solved by the bot. Most platforms collapse those into one number and end up overstating bot performance. We split them deliberately.
What good looks like varies more than people expect. For a SaaS product with a clean knowledge base and well-defined product, total resolutions can sit at 70-85% of total chats. For a complex enterprise account, the same bot might land at 35-50% — and that's still healthy if the unresolved chats are routed cleanly. Don't anchor on industry benchmarks; anchor on your own trend over time.
To measure it accurately, you have to define resolution explicitly. We use three signals: the user expressed satisfaction (thumbs up, "thanks", "got it"), the chat closed without escalation, and no follow-up ticket appeared in the next 48 hours. The last criterion catches the bots that "resolve" issues by giving wrong answers that come back to bite you in email two days later.
The pitfall here is treating resolutions as a count when it should be a rate. Total resolutions in absolute terms goes up with traffic, which masks regressions. If your traffic doubled and your resolutions only went up 40%, your bot got worse, not better. Always pair the count with resolution rate (metric 6 in this list).
To improve total resolutions, the most useful move is usually fixing your top 10 unresolved intents — the questions your bot keeps fumbling. Pull the transcript log filtered to escalations, group by topic, and you'll find the same five complaints over and over. We've consistently seen +15-25 percentage points of resolution lift inside a month from this exercise alone, no model change required. If you're not sure where to start, our guide on how to test your AI chatbot walks through the prioritization in detail.
5. Human support switch rate per conversation

Human support switch rate is the percentage of chatbot conversations that end up handed off to a human agent. It's the inverse signal of containment, and in some ways it's more honest. A high switch rate is the bot saying, "I tried, but this one needs a person."
The number itself isn't good or bad. The right switch rate depends on your customer base, your product complexity, and how aggressive you want the bot to be. A consumer e-commerce bot can run a switch rate of 8-15% and feel right. A B2B SaaS bot handling billing, integrations, and account-level questions might cruise at 35-50% and still be doing its job. The trick is monitoring direction, not absolute level.
When you investigate switches, the most useful breakdown is by trigger. Did the user explicitly ask for a human? Did the bot detect frustration (repeated questions, profanity, sentiment drop)? Did it hit a confidence threshold and escalate proactively? Each of those is a different problem to solve. Explicit asks usually mean the bot's introduction needs work — users don't trust it. Frustration triggers mean intent recognition is failing somewhere upstream. Confidence escalations are usually the healthiest kind, and you want more of those, not fewer.
One pattern that surprised me in our customers' data: switch rate is the metric most closely correlated with CSAT. Bots with very low switch rates often have terrible satisfaction scores because they're forcing users through dead-end loops rather than admitting they don't know. A slightly higher switch rate, when paired with fast handoff, almost always wins on satisfaction.
The pitfall: optimizing switch rate down without measuring what's behind the switches. Some teams hit the bot with prompt engineering until the model refuses to escalate. The switch rate plummets, the CSAT cratters quietly, and three months later they wonder why churn is up. Always pair switch rate with first-response time on the human side and with downstream satisfaction.
To act on it, I review the bottom-decile switches every week — the ones where the bot escalated after just one or two user messages. Those are the easy wins. Either the bot needs a knowledge update for that intent, or the routing is over-eager. Both are fixable in an afternoon.

6. Resolution rate

Resolution rate is the percentage form of total resolutions. It divides the number of chats fully resolved by the bot by the total chats in the period. Where total resolutions is a count, resolution rate is a quality signal — it adjusts for traffic and lets you compare weeks, channels, or product lines on the same axis.
This is the single most-quoted KPI in chatbot literature, and it's also the most-mangled. Definitions vary wildly. Some platforms count "didn't escalate" as resolved. Others require explicit user confirmation. Others use sentiment analysis to infer satisfaction. Whatever your platform's default is, look at it once, then decide whether you agree with it. Most teams don't, and they end up reporting numbers that don't match the user experience.
For our customers, the cleanest definition combines three checks: the bot didn't escalate, the user didn't return with the same intent within 48 hours, and the post-chat rating (when offered) was 3 stars or higher. That's stricter than the industry default, and it produces resolution rate numbers that look "lower" but actually predict CSAT and retention much better.
What good looks like: 60-75% for a mature deployment with a clean knowledge base and a focused use case. Lower than that suggests you have intent gaps. Higher than 85% usually means your definition is too generous, or you're filtering out the hard chats before they ever reach the bot.
The pitfall is treating resolution rate as a single number for the whole bot. It's almost always more useful disaggregated — by intent, by channel, by user segment. We had a fintech customer whose overall resolution rate sat at 64%, which looked fine. Sliced by intent, the "password reset" topic was at 92% and "dispute charge" was at 22%. Same bot, completely different stories. The fix was obvious once we saw the breakdown: more training data and a tighter handoff trigger on the dispute flow.
Resolution rate is also the metric most directly tied to ROI. If you bump it from 50% to 65% on a queue of 10,000 chats a month, you've removed 1,500 conversations from your human queue. At realistic per-chat human cost, that's tens of thousands of dollars a year. The deeper read on this trade-off lives in our piece on chatbot pros and cons, which walks through where deflection goes wrong.
7. Total conversations handled by human agents

This metric counts the chats that landed on human agents — either because the bot escalated them, the user asked for one, or the chat started as a human-led session from the beginning. Together with switch rate, it tells you how much load is actually arriving at your team's queue.
The reason this gets its own metric (rather than being inferred from switch rate) is that not every escalation results in human work. Some users abandon during handoff. Some chats get auto-closed before an agent picks them up. The "handled by humans" count is the true workload number, and it's what you should staff against.
To make this number useful, segment by team or by topic. We saw one customer whose human-handled count was relatively stable but had silently shifted from billing inquiries to integration support over six months. Their billing team was over-staffed. Their integration team was drowning. The total number stayed the same, so nobody noticed until we pulled the breakdown.
What good looks like: the number should track your switch rate proportionally. If switch rate is steady but human-handled goes up, your bot is escalating chats that are getting picked up faster (good). If switch rate is steady but human-handled drops, chats are getting lost between bot and human — usually a routing or notification problem (bad).
The pitfall: confusing this with productivity. Some leaders see a high human-handled count and conclude their team is working hard. They might be — or they might be drowning in chats the bot should have caught. Always read it alongside resolution rate and switch rate. A team handling 500 chats this week vs. 300 last week is only "more productive" if those 200 extra chats were the right kind to escalate.
To act on it, I'd recommend a monthly capacity review where you correlate human-handled volume with average handle time and CSAT. If volume is rising faster than capacity, you're either understaffed or your bot needs more training data on the topics that keep escalating. The fix usually isn't more agents — it's better routing.
One last note: this metric is the cleanest input to your cost-per-chat calculation. Multiply it by your loaded human cost per interaction, divide by total chats, and you get the dollar value of every percentage point you move on resolution rate. We use it as the headline number in any business case for bot improvements.
8. Closed conversations handled by human agents
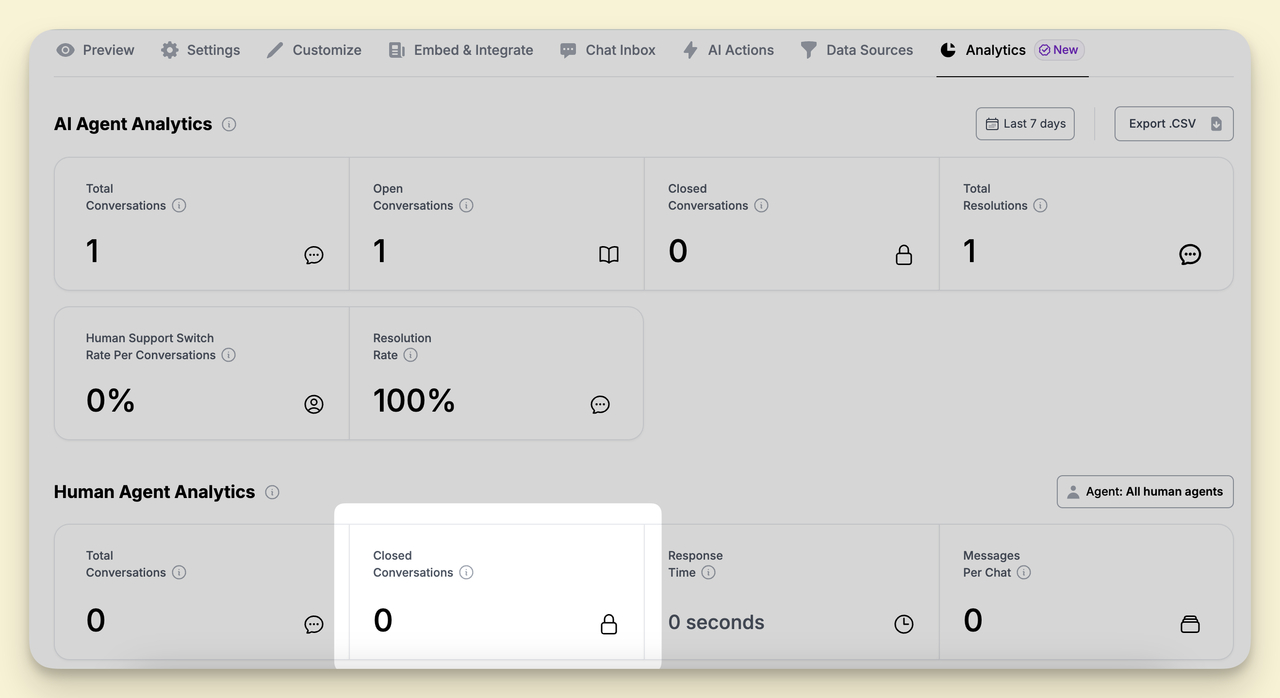
Closed conversations handled by human agents is the subset of human-handled chats that the team brought to a clean close — resolved, rated, and wrapped up. It's the human-side mirror of total resolutions, and it tells you how much of your team's queue actually gets finished vs. how much sits in limbo.
Same trap as the bot side: closed isn't the same as resolved. A human agent can close a chat without solving the user's problem (declined the request, transferred to email, told them to call back). To make this metric useful, you need to slice it by closure type. We use four buckets: solved, deferred, transferred, abandoned. The first two are healthy. The second two are warnings.
What good looks like: human agents should close 90%+ of what they accept within the same shift. Anything lower means chats are being held overnight, which destroys CSAT. We've watched closure latency go from 4 hours to 22 minutes after a customer added a simple "claim and close in one session" rule to their workflow, and their CSAT lifted 11 points in the next month.
To measure this well, look at the distribution, not the average. Average closure time can hide a long tail of chats that sit for days. A median closure of 15 minutes with a 95th percentile of 6 hours tells you that most chats are fast but some are catastrophic. Pull the catastrophic ones, find the pattern, and fix the workflow.
The pitfall: treating closures as a productivity metric. Reward agents for closing chats and you'll see them close them faster — sometimes prematurely. Pair closure with two cross-checks: the user's post-chat rating and the rate of follow-up tickets in the next 72 hours. If closures rise but follow-up tickets rise too, you've created a quality problem.
What I act on weekly: the chats that close without a rating. They're the silent middle — not great, not bad, no signal. We sample 10 of those each Friday and read them as a team. Often the agent did fine, but the closing message didn't invite feedback. A small wording change at the end can lift response rate from 12% to 35%, which gives you a much richer dataset to work with.
For teams scaling up their human support layer, this metric is also the cleanest input to per-agent capacity planning. It tells you, agent by agent, how many chats they can fully complete in a shift — which is much more useful than chats accepted, chats touched, or any other half-measure.
9. Response time of human agents

Response time of human agents is the average gap between when a chat lands in the human queue and when an agent sends the first message. It's the single most-felt number in the entire support stack, and it's the one users will mention by name in churn surveys.
The threshold matters more than people expect. Our customer data shows CSAT collapses sharply once response time crosses about 90 seconds — below that, satisfaction is mostly flat; above it, it falls off a cliff. So response time isn't a linear lever. There's a soft cap at 30 seconds (great), an acceptable band to about 90 (fine), and then a falling-off-the-edge zone after that. Aim for the soft cap, defend the band, and never let yourself slip into the zone for more than a single shift.
To measure it correctly, separate out two phases. The "queue time" is from chat arrival to agent acceptance. The "first reply time" is from acceptance to first message. They have different fixes. Queue time is a staffing problem (or a notifications problem). First reply time is usually a tooling problem — agents searching for context, opening the right knowledge base article, copying customer info from another system. We've seen first reply time drop by 40% just from giving agents a one-click summary of the chat history before they take it.
What good looks like: median queue time under 30 seconds, median first reply under 45 seconds. The 95th percentile is more important than the median. If your 95p queue time is 8 minutes, you've got a small but meaningful population of users who are getting a terrible experience, and they're the ones who churn or complain publicly.
The pitfall: optimizing response time at the expense of resolution time. If agents type a generic "thanks, looking into this" within 5 seconds and then disappear for 10 minutes, your response time looks great while your CSAT plummets. Pair response time with first-message-quality (a manual review sample is fine) and with full resolution time. The combo prevents the gaming.
To act on it, I'd recommend a real-time alert when the queue grows beyond a threshold (we use 3 chats waiting per available agent). It pings a Slack channel, and a backup agent jumps in. That single pattern keeps our 95p response time under 90 seconds even on peak days.
One last point: response time gets way better when the bot does a clean handoff. If the bot summarizes the issue, attaches relevant knowledge base links, and tags the conversation by topic, the agent's first reply comes much faster because they don't have to start from scratch. The bot's quality and the agent's response time are linked, even though they live in separate dashboards.
10. Messages per chat by human agents

Messages per chat by human agents counts the average number of messages the human agent sends within a single conversation. It's a depth metric — high numbers usually mean complex chats, low numbers usually mean simple ones, and the trend over time is more interesting than any single value.
The temptation is to interpret high messages-per-chat as "less efficient." Sometimes true. More often, it just means the agent is doing detail work — clarifying questions, walking through screenshots, multi-step troubleshooting. Don't optimize this number to a target. Watch its distribution and look for the outliers.
What's actually useful is the trend at the chat-type level. If messages per chat for the "billing" topic creeps up over six weeks, you have a knowledge base or product clarity problem. Users are asking the same follow-up questions because the first answer wasn't clear enough. The fix is upstream — in the help center, in the product UI, or in the bot's pre-handoff message — not at the agent.
To measure it cleanly, exclude system messages, boilerplate openings, and templated closings. Otherwise the number is dominated by canned text and tells you nothing about how much actual work is happening per chat. Most platforms count everything; you'll need to filter intentionally.
The pitfall: using messages per chat as a productivity target. Set a low ceiling and you'll see agents close chats prematurely. Set a high floor and you'll see them pad conversations to look busy. Treat it as a diagnostic, not a scorecard.
What good looks like depends on chat type, but as a rough guide: simple inquiries should average 4-6 messages from the agent, mid-complexity issues 8-12, and deep technical troubleshooting 15-25. Anything wildly outside those bands deserves a closer look.
To act on it, I run a monthly review where we pull the chats with the highest message counts and ask one question: was this complexity necessary? Sometimes yes (genuinely hard problem). Sometimes no (agent didn't have the right tool, customer didn't have the right info up front, or the bot escalated too early and dumped half-translated context on the agent). Each "no" is a process fix waiting to happen. Over a year, that ritual alone has shaved our average human-handled chat from 14 messages to 9, which is a meaningful capacity win without any change in headcount.
How to set up chatbot analytics tracking
Setting up analytics is mostly about restraint. The default urge is to turn on every metric your platform offers, build a 30-tile dashboard, and call it done. Two months later, nobody opens the dashboard. The setup that actually works is much smaller and a little harder to commit to.
Pick your three north-star metrics first
Pick three metrics, not ten. The three I recommend for almost every team: resolution rate, switch rate, and CSAT (or post-chat thumbs). Those three together tell you whether the bot is doing its job, whether it's escalating wisely, and whether users feel cared for. Anything else is supplementary. If you can't justify a metric in one sentence ("we look at this because..."), don't put it on the main dashboard.
The reason restraint matters: when you have ten metrics, you watch all of them shallowly. When you have three, you actually internalize them. Your team starts to know the trend lines by heart, notice anomalies on day one, and act on them. That's the entire point of analytics. Numbers nobody acts on are theatre.
Pick the three based on your stage. Pre-launch and the first 30 days, lean on volume metrics so you understand the shape of demand. After 30 days, switch to quality metrics — resolution, switch, satisfaction. After 90 days, layer in business metrics like cost per resolution and downstream conversion. Don't try to do all three at once.
Connect data sources and event triggers
The setup work most people skip is connecting events from the bot to the rest of the stack — your CRM, your ticketing system, your product analytics. Without those connections, you're stuck with bot-only data, which is fine for tactical decisions but useless for strategic ones. You can't tell whether bot users churn at lower or higher rates. You can't tie containment to revenue. You can't tell whether the chat that closed yesterday became an angry email today.
The minimum integration set: write each chat's metadata (intent, resolution status, escalation type, CSAT) into your CRM as a contact event. Push closure events to your ticketing system so support knows what's already been answered. And tag the chat session ID inside your product analytics so you can join chat behavior with feature use, conversion, and retention.
Event triggers come next. Set explicit rules for what counts as a resolution (we covered ours above). Set rules for what triggers an escalation (intent confidence below threshold, sentiment drop, repeated question, explicit ask). Set rules for what triggers an alert to a human (high open count, response time over threshold, CSAT below target for the day). Don't rely on platform defaults — they're set for general use, not your specific business.
Build a baseline before changing anything
The most important step in setup is the most boring one: leave everything alone for two full weeks. Don't tune the bot, don't change responses, don't deploy new flows. Just watch. You're collecting baseline data, and any optimization done before that baseline exists is guessing.
During the baseline period, you'll see seasonality. You'll see day-of-week patterns. You'll see anomalies (a marketing campaign drove a chat spike, a holiday flattened volume). All of that becomes your reference for what "normal" looks like. Once you know normal, you can spot deviations — and deviation is the entire game.
If you're tempted to skip this and start optimizing immediately, ask yourself a question: how will you know whether your changes worked? Without a baseline, you can't tell signal from noise. You'll change three things at once, see a 5% movement, and have no idea which change caused it. Two weeks of patience saves months of confusion later.
Schedule a weekly review cadence
The last setup step is the one most teams forget: put a recurring meeting on the calendar to review the dashboard. 30 minutes, weekly, same time, same people. The agenda is simple — what changed since last week, why, what's the action. Without the meeting, the dashboard becomes wallpaper.
What I look at in the weekly review: the three north-star metrics with their week-over-week deltas, any alert that fired during the week, the lowest-rated five chats, and one diagnostic deep-dive on whatever looked weird. The meeting ends with one to three concrete actions assigned to a person with a deadline. That's it. The discipline of "we always end with actions" is what turns analytics from a reporting habit into an improvement engine.
For teams running rigorous testing, the weekly review pairs naturally with a periodic full audit — the kind we describe in our chatbot quality assurance guide. Treat the weekly review as the maintenance loop and the audit as the deeper inspection.
Tips to improve chatbot performance based on analytics
Enhance NLP and AI capabilities
The first place to invest is the bot's understanding. The cleanest signal here is the missed-utterance log — every time the bot said "I'm not sure I understand," "Could you rephrase," or its equivalent, that's a training data gap. Pull the top 50 missed utterances by frequency, group them by intent, and feed them back into your training set. We've seen first-pass intent accuracy lift from 71% to 88% inside three weeks from this exercise alone.
If you're on a generative bot rather than a rule-based one, the equivalent move is updating your retrieval set. Pull the chats where the bot answered confidently but the user followed up with confusion or "that's not what I asked" — those are retrieval misses, not classification ones. Add the right answer to your knowledge base and re-index.
Update content and responses regularly
Chatbot responses go stale faster than people expect. Pricing changes, product features ship, integrations break, support policies shift. If your knowledge base hasn't been audited in six months, your bot is serving outdated answers, and your users notice immediately. We run a monthly content refresh: pull the answers that the bot served most often that month, check each one against current product reality, update the ones that drifted.
The catch is that "updated" doesn't always mean "rewritten." Sometimes the existing answer is fine but is missing a clarification a customer asked for repeatedly. Watch the post-answer behavior — if users ask a follow-up immediately after a particular response, that response is incomplete, even if it's not wrong. The fix is to incorporate the implied follow-up into the original answer.
Personalize conversations with user context
Personalization is the highest-ROI improvement you can make if you have customer data flowing into the chat. Knowing who the user is — their plan, their last support ticket, their recent product activity — lets the bot skip the "what's your account ID" preamble and answer directly. We've measured first-resolution time drop by about 35% on chats where the bot has account context vs. chats where it doesn't.
The minimum useful personalization: pass plan tier, signup date, and last activity timestamp into the bot's context window. With those three, the bot can route differently for free vs. paid users, recognize new users vs. veterans, and detect when something is off (a high-value customer who hasn't logged in for two weeks is a churn risk). Don't overbuild this. Three fields is enough to start.
Optimize conversation flow with branching tests
If your bot uses scripted flows for common intents (onboarding, pricing questions, demo booking), test them like landing pages. Set up two versions of the flow with one variable changed — different opening question, different number of steps, different fallback wording. Run them against alternating users for two weeks, then look at completion rate and CSAT. We've seen flow completion lift by 20% from changes as small as moving the "do you want to talk to a human" option from step 5 to step 2.
The trick is changing one variable at a time. Multi-variable tests on conversational flows are statistically a mess unless you have huge volume. Most teams don't, so disciplined single-variable iteration wins. It feels slow. It's actually the fastest path to a flow that works.
Incorporate user feedback as a primary signal
The richest data on your bot lives in unstructured user feedback — the post-chat surveys, the support tickets that mention "your bot," the social media complaints. Quantitative metrics tell you what changed. Qualitative feedback tells you why. Read it weekly. Not summarize, not aggregate — read the actual messages.
I block 30 minutes every Friday to read the lowest-rated chats and the verbatim survey responses from the week. It's the most valuable 30 minutes in my week. Half the time, the issue is something the metrics didn't show — a tone problem, a confusing handoff message, a knowledge base article that's technically correct but reads like it was written for engineers. None of that surfaces in dashboards. All of it surfaces in three hours of close reading per month.
Common chatbot analytics pitfalls
Vanity metrics that don't drive action. Total conversations and message counts make for nice charts but tell you almost nothing about whether the bot is doing useful work. If you can't connect a metric to a specific action you'd take when it moves, drop it from the dashboard.
Sample size traps in early-stage data. Drawing conclusions from 50 chats is statistical theatre. Wait until you have at least a few hundred resolved conversations per intent before treating any number as a real trend. Anything earlier is anecdote dressed up in percentages.
Attribution gaps between bot and outcome. Most teams can't tie a chat to a downstream business event — a renewal, a churn, an upsell. Without that link, "containment rate went up 5%" is a number with no business meaning. Set up the attribution before you start optimizing.
Missing edge cases in the resolved bucket. The chats labeled "resolved" by your platform almost always include some that weren't really resolved — the user gave up, the bot timed them out, or they got a wrong answer they didn't catch. Audit a sample of resolved chats every month to keep your definitions honest.
Over-reliance on CSAT alone. CSAT is useful but biased. Happy users rate often, frustrated users sometimes don't bother, and the truly angry ones write to your CEO instead of clicking the smiley. Pair CSAT with completion rate, follow-up ticket rate, and qualitative feedback to get the full picture.
Neglecting the voice of the customer in transcripts. Dashboards aggregate. Transcripts tell stories. If nobody on your team is reading actual chats — not summaries, the actual conversations — you're missing the most important signal you have.
Not tying metrics to product fixes. Many bot problems aren't bot problems. They're product problems showing up in chat. If 40% of your bot escalations are about a confusing checkout step, the fix isn't more bot training. It's a product change. Chatbot analytics should feed product roadmaps, not just chatbot tuning queues.
Track three chatbot metrics this week
If you only do one thing after reading this, pick three metrics and start watching them tomorrow. Resolution rate, switch rate, satisfaction. Set up a weekly 30-minute review. Read five low-rated transcripts each Friday. That single routine, run for two months, will teach you more about your chatbot than any tool upgrade.
The teams that win at chatbot analytics aren't the ones with the biggest dashboards. They're the ones who turned a small, honest set of numbers into a weekly habit and shipped one improvement at a time. That's the entire playbook. Build the discipline, then layer in complexity as you grow.
If you're starting from scratch and want a sharper test plan for your bot before you start measuring it in production, our piece on how to test your AI chatbot is the next step. And if you're scoping a new bot project entirely, our roundup of chatbot business ideas covers the use cases that produce the cleanest analytics from day one.
Frequently asked questions
What are the key metrics to measure a chatbot's success?
The three most useful chatbot metrics are resolution rate (what percent of chats the bot finished without help), human switch rate (how often it escalated), and post-chat satisfaction. Together they cover effectiveness, escalation quality, and user perception. Most teams add total conversations and response time as supporting volume metrics. Beyond those five, additions should solve a specific question, not pad the dashboard.
If you're on a generative bot, add intent confidence and hallucination rate to the list. Those are unique to LLM-based deployments and don't appear in older platforms. They tell you when the bot is making things up vs. answering from the knowledge base, which matters more in 2026 than it did even a year ago.
How do I track my chatbot's performance?
Use your platform's built-in dashboard for the daily numbers, then connect chat events to your CRM and product analytics for the strategic view. The minimum useful setup: a dashboard with three to five north-star metrics, weekly transcript reading for qualitative signal, and a monthly review that ties metric changes to specific bot or product fixes.
For deeper analysis, schedule a quarterly audit where you sample 50-100 chats across intent types and read them blind. The audit catches the issues dashboards miss — tone, edge cases, retrieval errors. Combine the dashboard, the transcripts, and the audit and you have a complete view.
What is the chatbot containment rate?
Containment rate is the percentage of chats that the bot fully handled without ever escalating to a human. It's similar to resolution rate but stricter — containment requires the bot to be the only handler, where resolution sometimes counts cases where a human nudged the bot back on track. We cover the difference and how to optimize it in our piece on chatbot containment rate.
Healthy containment rates land between 40% and 75% depending on use case. Higher than 80% is suspicious — usually it means your platform's definition is too generous, or you're filtering hard chats out before the bot ever sees them. Lower than 30% means either your bot is under-trained or your customer base is asking complex questions the bot was never going to handle.
How can I improve my chatbot's user engagement?
The fastest engagement wins are about the first 30 seconds of the chat. A clear, specific opening message ("I can help with billing, account, or technical questions — what's going on today?") outperforms a generic "How can I help?" by a wide margin. Make the entry friction-free, and engagement follows.
Beyond the opening, personalization is the next lever. Know who the user is, skip the data-collection preamble, and route directly to relevant intents. Visual variety helps too — quick reply buttons for common paths, inline images for documentation, and the option to upload a screenshot when describing a problem. The voice of the bot matters as well; we walk through that in our piece on chatbot persona.
What's the difference between resolution rate and containment rate?
Containment rate tracks whether a human ever got involved. Resolution rate tracks whether the user's problem actually got solved. A chat can be contained but not resolved (bot answered, user gave up confused) or resolved but not contained (bot tried, escalated, human solved it). They're different signals and they answer different questions.
For a strict deflection ROI calculation, use containment rate — it tells you how many human-handled chats you avoided. For a customer experience read, use resolution rate — it tells you how many users actually got what they came for. Most mature teams report both side by side.
How often should I review chatbot analytics?
Weekly for the dashboard, monthly for the deep dive, quarterly for a full audit. Daily review is mostly noise — chat metrics are too sensitive to short-term variation to read meaningfully day by day. The exception is real-time alerts on operational thresholds (queue length, response time spikes), which should fire to a Slack channel and be acted on immediately.
The weekly cadence is the most important. It's frequent enough to catch problems before they compound and infrequent enough that the team takes the meeting seriously. Skip a week and the next meeting becomes "what happened over the past 14 days," which is too much to cover in 30 minutes.
Further reading on chatbot analytics and quality:
Chatbot Containment Rate in 2026
How to Test Your AI Chatbot? Techniques, Tools, and Metrics
Chatbot Quality Assurance (QA): The Fundamental Guide
12 Essential Chatbot Features for 2026


