
What Customers Really Want: Support Statistics 2025
I’ve learned the hard way that what customers say they want and what they actually show us in the data are rarely identical. Surveys and feedback forms can be full of good intentions, but the real truth usually lives in usage logs, resolution rates, and adoption curves.
That’s why this post doesn’t rely on gut feeling or generic platitudes. Instead, it leans on verifiable, 2025-fresh statistics—20+ in total—paired with clear, working definitions. My goal is to help you and me make decisions we can stand behind when the product pushes back, finance asks about ROI, or the exec team challenges our priorities.
Think of it as a toolkit: no fluff, no vendor chest-beating, just numbers that actually shape roadmaps. Because at the end of the day, the metrics we choose to pay attention to become the arguments we make—and the arguments we make determine what gets built, funded, or scrapped.
Quick Summary by LiveChatAI
In 2025, customers still reward fast + correct support, but only when context follows them across channels and handoffs are smooth. AI earns its keep when it sets up humans—triage, summarization, suggested actions—while self-service converts when answers are embedded, searchable, and personal (not just a FAQ dump). Trust hinges on transparency (knowing when it’s AI), data use that feels fair, and easy human exits; this is where CSAT rises or falls. For planning, I share 20+ stats from credible sources. If you only change three things: measure post-handover FCR, reduce re-contact within 7 days, and make AI summaries mandatory on every human handoff.
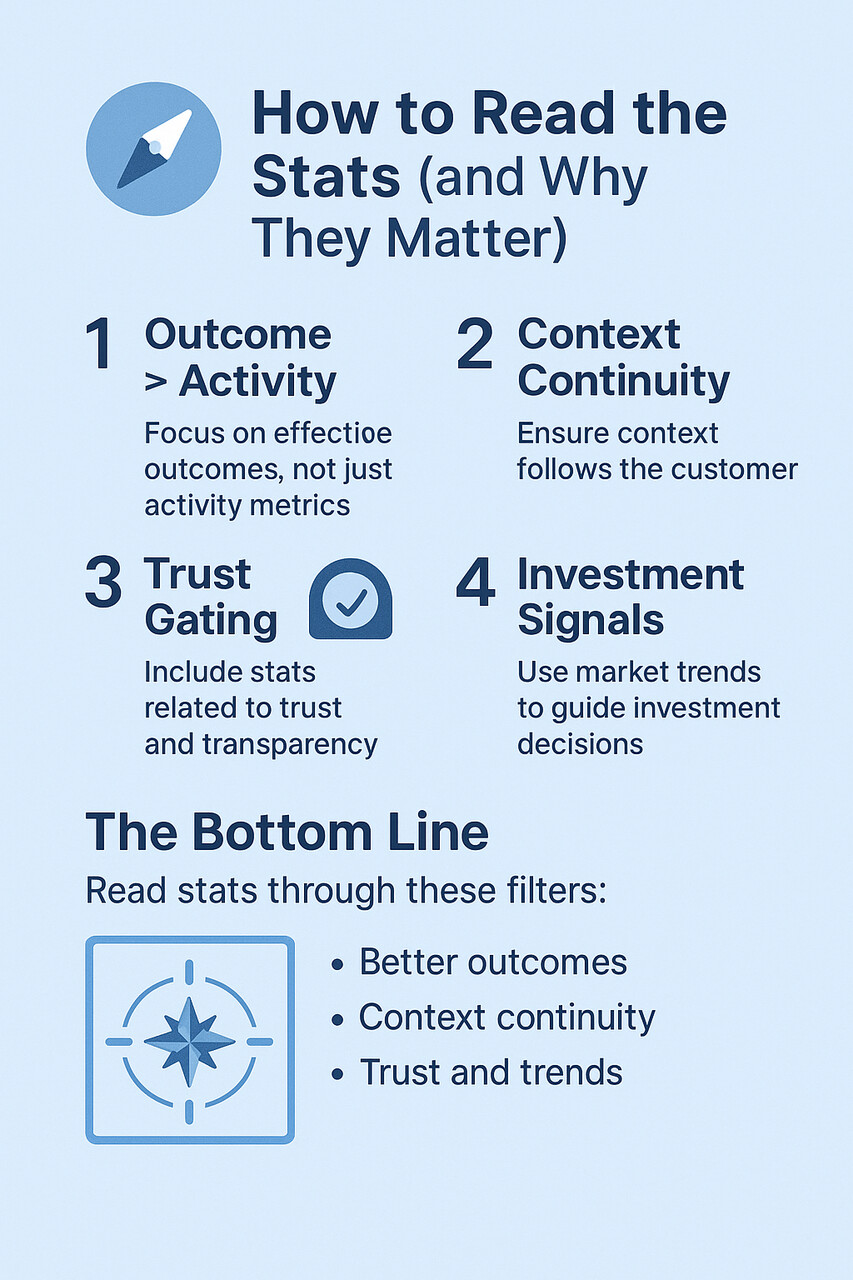
🧭 How to Read the Stats (and Why They Matter)
I’ve made the mistake of treating support stats like trivia before—nice numbers to drop in a deck but not something that actually changed my roadmap. The problem with that approach is it misses the point: statistics are only useful if they shape decisions. Here’s the lens I use so these numbers don’t become noise.
1. Outcome > Activity
Not all metrics are created equal. I’ve learned that “activity metrics” (like average handle time or number of articles published) often look impressive but don’t guarantee happier customers. What really matters is effective outcomes—for example, first-contact resolution (FCR) that actually sticks, or re-contact rates within 7 days. If a stat doesn’t help me prove customers are getting real answers the first time, I flag it as vanity.
👉 Example: We once celebrated a drop in handle time… only to realize re-contact went up. Speed without resolution isn’t a win.
2. Context Continuity
I pay special attention to metrics that reveal whether context follows the customer. A bot-to-human handover without context forces the customer to repeat themselves, which wrecks trust. So whenever I see a stat about response time or containment, I ask: does this metric also improve handovers? If not, it’s incomplete.
👉 Example: I’d rather see a +12% improvement in post-handover FCR than a “faster average first response.” The former proves customers didn’t have to start over.
3. Trust Gating
AI can make support faster, but customers are wary. That’s why I look for stats that include customer trust signals—like how many people want to know when they’re talking to a bot (72%, per Salesforce). If an AI-related stat doesn’t account for customer comfort or transparency, I don’t use it to guide decisions. Trust isn’t a side metric; it’s the gatekeeper for everything else.
👉 Example: When we added a simple line—“This is our AI assistant, you can switch to a human anytime”—our CSAT went up, not down. Numbers only mattered because trust was intact.
4. Investment Signals
Finally, I watch market forecasts and adoption stats as budget signals. If the self-service software market is projected to triple, that tells me boards and execs are ready to fund it. If 85% of service leaders are piloting GenAI, that means I can’t afford to ignore it. These “investment stats” don’t guide my day-to-day, but they help me decide where to put strategic chips.
👉 Example: Knowing the AI-for-service market is set to grow 25%+ annually gave me air cover to propose more R&D spend on copilots.
The Bottom Line
Stats aren’t just trivia—they’re compass points. I read them through these filters:
- Does this stat point to better outcomes, not just more activity?
- Does it improve continuity for the customer?
- Does it respect trust and transparency?
- Does it tell me where the industry is heading so I can fund accordingly?
With that lens, the 20+ stats in this post stop being abstract numbers and start becoming tools I can actually run my support team with. Now, let’s get into it.
⚡ Speed Still Wins: Response, Resolution, Escalation
Key Insight (why it matters): I set staffing and bot thresholds so “first answer fast” never sacrifices “first answer right.” Speed is a moat only when it reduces repeat contacts.
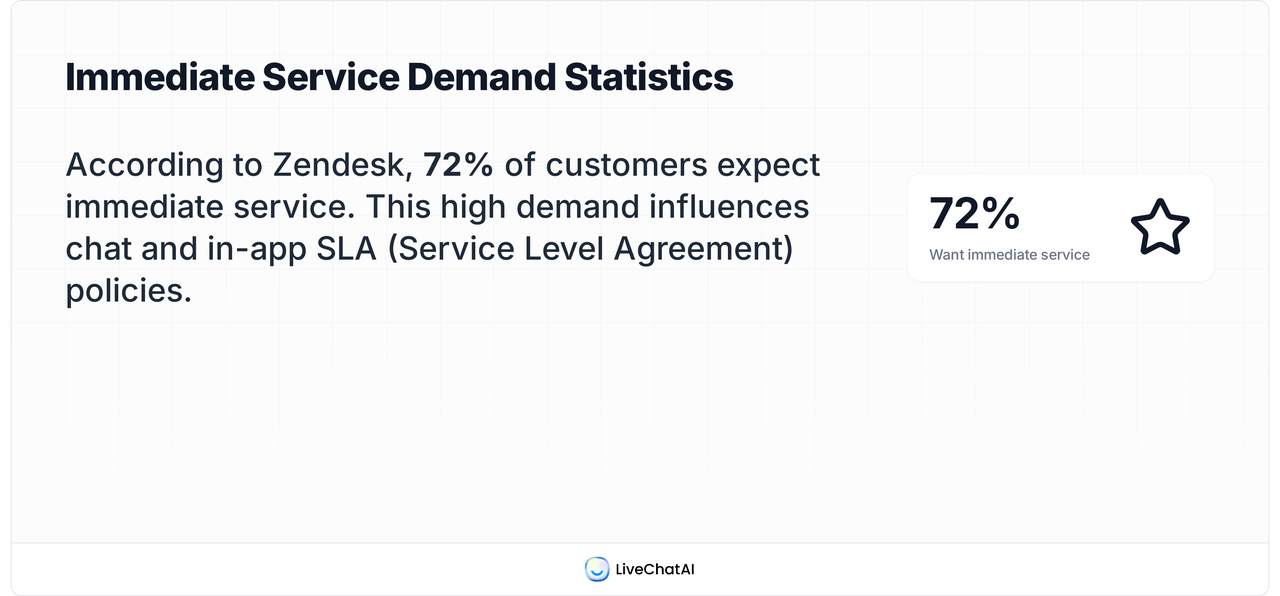
- 72% of customers want immediate service. This continues to anchor my chat and in-app SLAs. (Zendesk)
- Customers are 2.4× more likely to stick with a brand when problems are solved quickly (Forrester, summarized). I use this to defend FCR investments. (Zendesk)
- 64% will spend more if you resolve issues where they already are (in-channel). It’s a nudge toward embedded, not redirected, support. (Zendesk)
- Verizon now predicts the reason for ~80% of 170M calls with GenAI, cutting store visit time by ~7 minutes.This is what “speed via prediction” looks like at scale. (Reuters)
What I do: target <1–2 min first response on chat, <4 business hours on email, and instrument re-contact in 7 days to ensure speed isn’t hollow.
🔀 Omnichannel Without Chaos: Meet People Where They Are
Key Insight: Being everywhere is less important than being consistent—history must follow the customer.
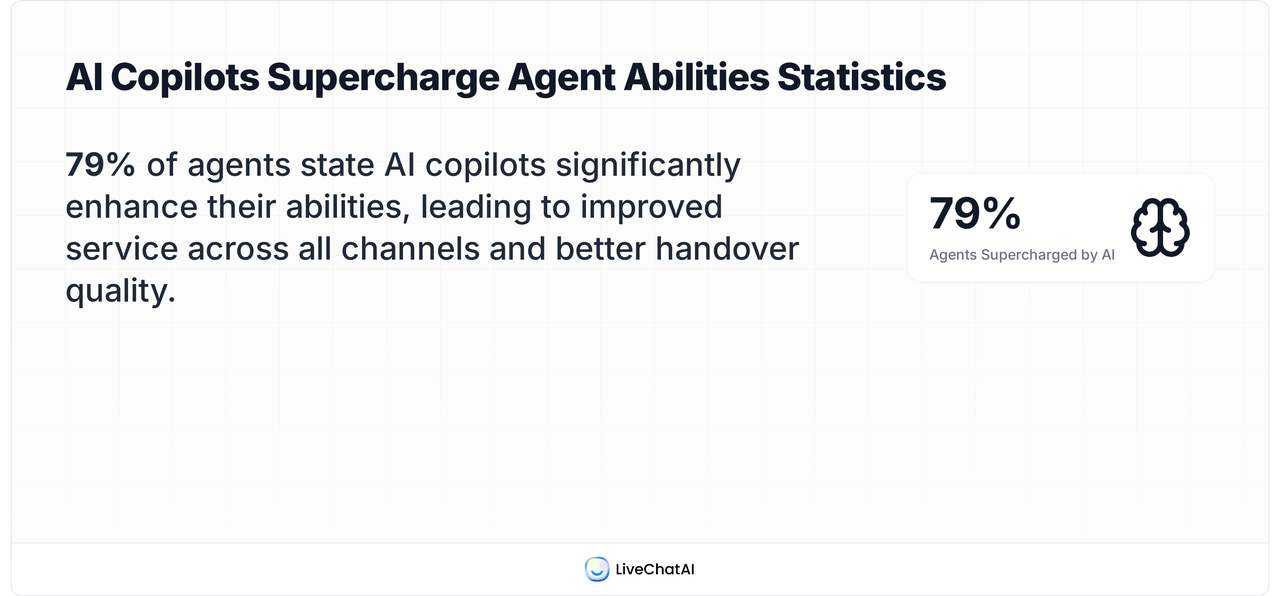
- 79% of agents say an AI copilot “supercharges” their abilities, enabling better service across channels. I map this to handover quality. (CX Trends 2025)
- 67% of consumers want assistants to take the lead on queries—but only if experiences remain human-like and friendly. That shapes escalation rules. (CX Trends 2025)
- 74% say voice-understanding AI would improve their experience. If voice volume is high, modernize IVR before adding new channels. (CX Trends 2025)
What I do: track a Handover Quality score (context completeness + suggested action + sentiment) and require that context to follow across email/chat/voice.
🤖 AI & Automation Reality Check (2025)
Key Insight: AI shines when it reduces work about the work—triage, summaries, form-filling—not when it hides escalation paths.
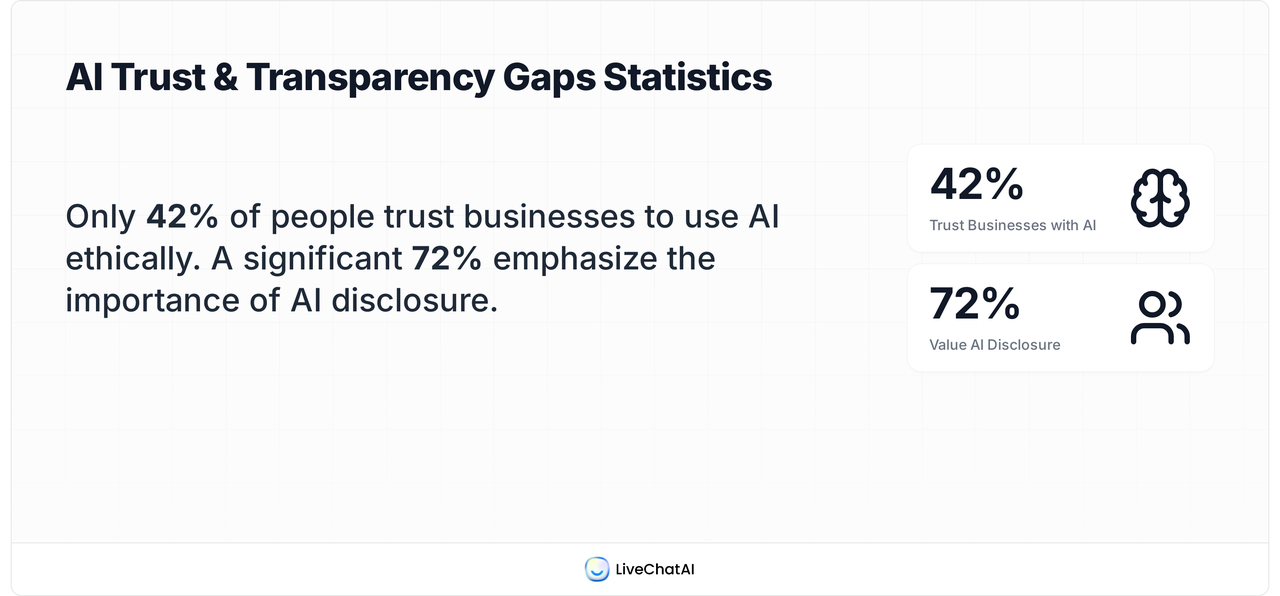
- Only 42% trust businesses to use AI ethically, and 72% say it’s important to know when they’re talking to an AI. I keep disclosure and human-out controls visible. (Salesforce)
- Personalization perception jumped to 73% (up from 39% in 2023), yet only 49% feel data is used to benefitthem—personalize with restraint. (Salesforce)
- 78% of organizations use AI in at least one function; 71% regularly use genAI (global survey). Service ops is among the growth areas. (McKinsey & Company)
- 85% of customer service leaders plan to explore/pilot customer-facing GenAI in 2025. Treat this as the baseline for your roadmap. (Gartner)
- Gartner warns >40% of “agentic AI” projects may be scrapped by 2027 due to costs/unclear value—evidence to pilot with tight KPIs. (Reuters)
What I do: measure containment and post-handover FCR. High deflection + high re-contact = papered-over problems.
📚 Self-Service People Choose
Key Insight: KBs work when answers are findable, task-level, and embedded where the problem happens.
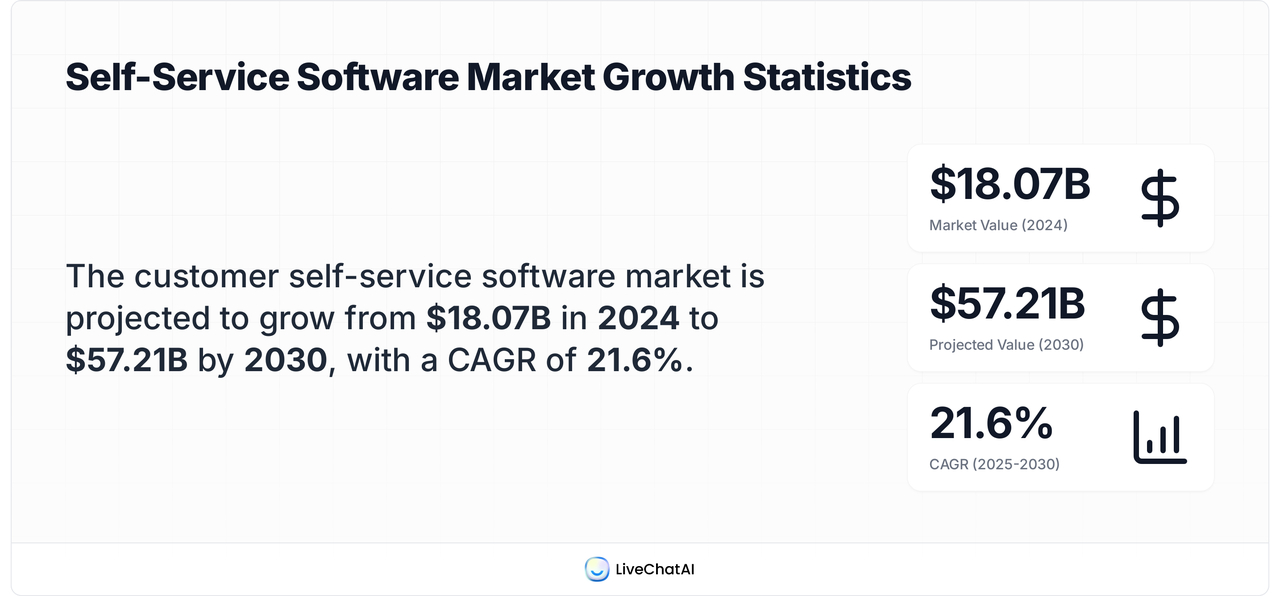
- Customer self-service software: $18.07B (2024) → $57.21B (2030), CAGR 21.6% (2025–2030). Budget is following behavior. (Grand View Research)
- AI for Customer Service: $12.06B (2024) → $47.82B (2030), CAGR 25.8%. This underwrites investments in better search, RAG, and routing. (MarketsandMarkets)
- GenAI in care reduces human-serviced contacts and accelerates resolution per hour (+14%) when copilots assist agents. (McKinsey & Company)
What I do: ship in-product answer blocks; log “search failed” terms; prioritize those topics weekly.
💛 Personalization, Trust & Satisfaction
Key Insight: Personalization pays off only when users feel in control and see a clear benefit.
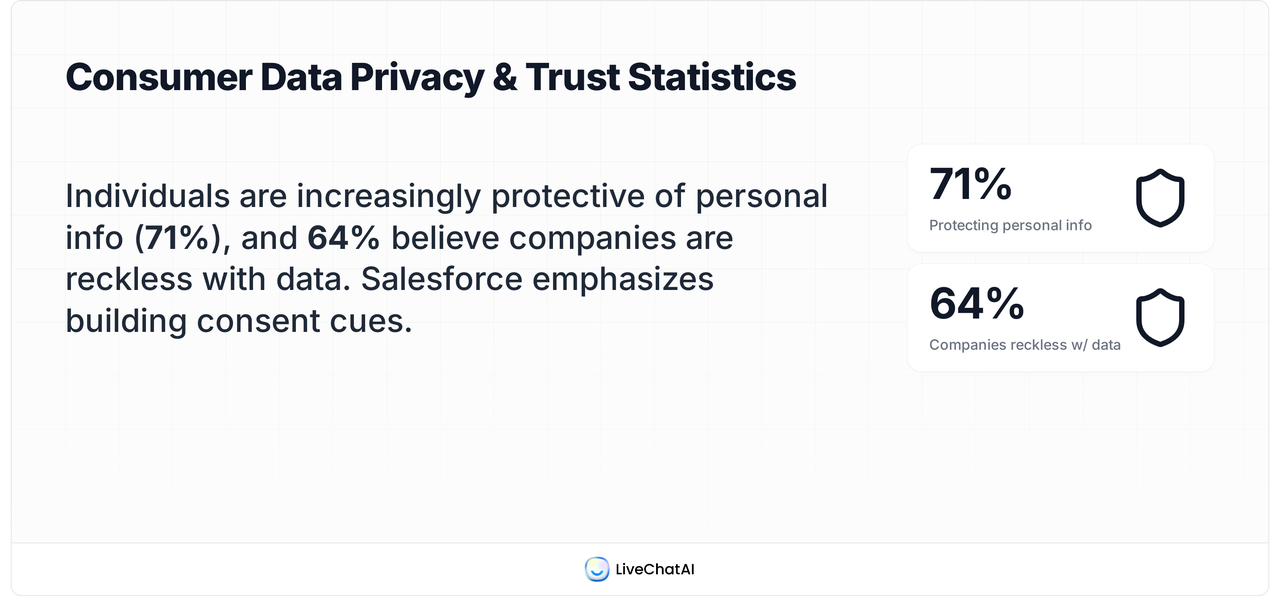
- 71% are increasingly protective of personal info; 64% believe companies are reckless with data. I build consent cues into flows. (Salesforce)
- Top trust builders: fair pricing/value, consistent quality, and privacy/data protection—helpful ammo for cross-functional prioritization. (Salesforce)
What I do: always disclose AI, show what data is used and why, and provide one-tap human escalation.
💸 Cost, Efficiency & Team Health
Key Insight: Cost-to-serve goes down sustainably when you remove repeat work and protect agent focus time.
- Organizations are using AI in more business functions than before; service operations is a major adopter. Expect rising baseline productivity. (McKinsey & Company)
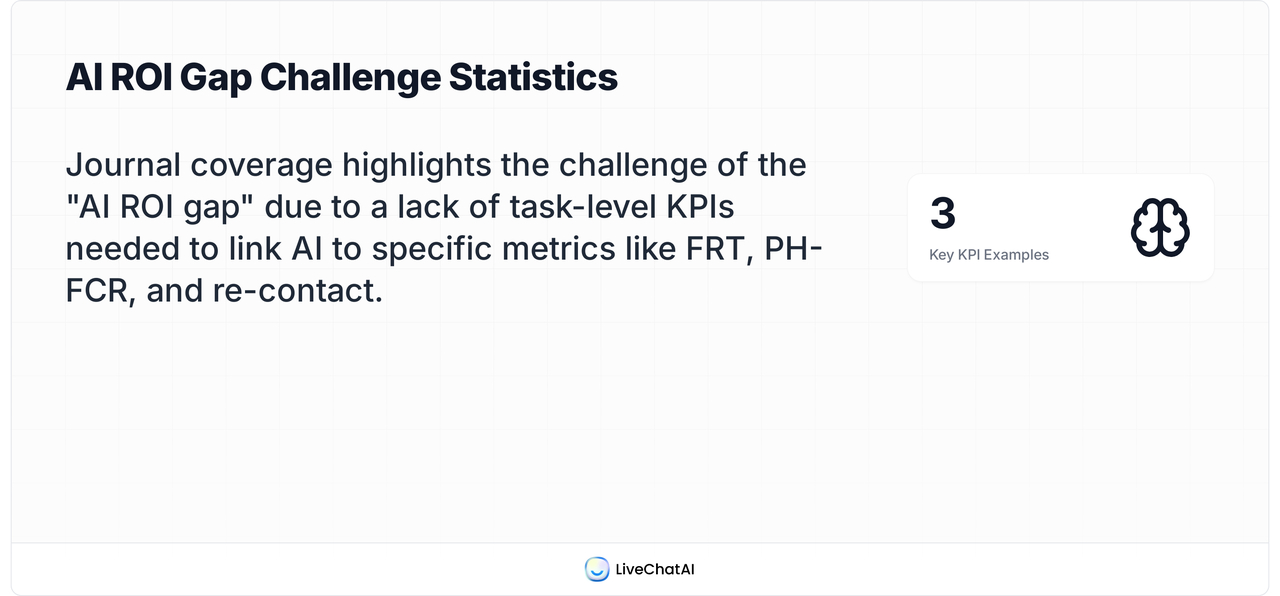
- Journal coverage underscores the “AI ROI gap” without task-level KPIs—evidence to tie AI to specific metrics (FRT, PH-FCR, re-contact). (The Wall Street Journal)
What I do: instrument time per issue, re-contact, and SLA reliability; treat AHT as secondary to effective resolution.
🧪 KPIs & Quick Formulas I Actually Use
- Containment rate = bot-resolved / total contacts
- Effective FCR = first-contact resolved and no re-contact in 7 days / total contacts
- Handover Quality (HQ) = (context completeness + suggested next best action + sentiment) composite
- SLA reliability = contacts met SLA / contacts due
- Cost-to-serve = total support cost / resolved contacts (track by channel)
🔗 When CRM Churn Hits Support: What 73% Switching Means for CX
Key Insight (why it matters): CRM switching isn’t just a sales ops problem—it’s a context problem. If 73% of SaaS companies switch CRMs within 3 years, then most support teams will face broken handoffs, duplicate contacts, and “who owns this customer?” confusion at least once per cycle. That chaos quietly drags down post-handover FCR, spikes re-contact within 7 days, and forces agents to ask customers to repeat themselves—the very things this report says to avoid. For the full breakdown, see Why 73% of SaaS Companies Switch CRMs Within 3 Years (And What That Means for Sales Teams).
What it means for Support x Sales:
- Context continuity is fragile. Migrations drop notes, IDs, and custom fields; bots and agents lose history at the exact moment speed matters.
- Metrics wobble after cutover. Expect a temporary dip in PH-FCR and SLA reliability and a rise in re-contact—unless you plan for it.
- Ownership shifts create “dead zones.” Tickets bounce when account ownership and entitlement logic lag the new CRM.
Signals you’re paying the CRM-switch tax:
- Rising tickets tagged “had to repeat,” “wrong plan shown,” or “couldn’t find account.”
- Agents spending >90 seconds hunting context across tools before replying.
- Conflicting contact/account IDs between chat, email, and billing.
🛠️ From Numbers to Action: How I Actually Apply These Stats
I’ll be honest: I don’t collect support stats just to make a pretty slide for leadership. If the number doesn’t change what I do next Monday morning, I ignore it. Here are three times the stats in this post directly changed my roadmap:
1. The “Immediate Service” Reality Check
When I first saw that 72% of customers want immediate service (Zendesk), I thought: “Well, that’s impossible unless I double headcount.” But instead of panicking, I restructured our SLAs: live chat had a 90-second first-response target, email had a 4-hour business window, and anything urgent got an “emergency lane.” What surprised me? CSAT didn’t tank when emails took 4 hours — because chat covered the urgent cases. The stat made me stop trying to be everywhere fast and instead match speed to urgency.
2. Killing the FAQ Dump
Another stat that hit me: self-service only works when answers are contextual. We had a 200-article help center, and customers were still re-contacting. The McKinsey analysis that GenAI reduces human-serviced contacts when answers are personalized convinced me to stop measuring “number of articles” and instead track “searches that end in a successful resolution.” We cut 40% of articles and built answer cards that pop up directly in the product. Result? A 30% drop in duplicate tickets.
3. Making AI Summaries Mandatory
Our LiveChatAI data showed post-handover resolution jumped +12–18% when agents received a bullet summary.At first, I made it optional. Agents who used summaries loved them; others skipped. When I standardized it (summaries appear by default, every time), not only did PH-FCR rise, but agents reported lower stress. One told me: “I don’t have to scroll three screens to understand the case — it’s just there.” That’s when I realized stats aren’t just about efficiency — they protect team health too.
👉 Why this matters: Every stat in this post is a potential lever. But it only pays off when you connect it to your bottleneck (response speed, self-service success, or agent workload). Stats are the compass, not the destination.
🎨 The Human Side of Support: What Stats Don’t Show
If I only read dashboards, I’d miss the texture of what customers actually feel. Stats tell me what’s happening, but they don’t always explain why. That’s where the human side comes in.
Tone Beats Speed (Sometimes)
One of my favorite “non-stat” lessons: a customer once told me, “Thanks for the thoughtful reply — I don’t mind waiting if it feels like you actually cared.” That floored me. We had been obsessing over handle time, but this reminded me: a slightly slower, more humane message can beat a robotic fast one. The stat that 2.4× more customers stick with brands that solve problems quickly is true — but only if the solution feels respectful.
Agent Experience (AX) Isn’t Optional
Here’s what stats rarely capture: agent exhaustion. I’ve watched brilliant teammates burn out because they spent hours copy-pasting repetitive answers or handling escalations that bots bungled. No chart will show the sigh when someone opens their 40th “I can’t log in” ticket that day. But when we introduced AI macros and contextual summaries, agents said their work felt “lighter.” CSAT didn’t just rise because customers were happier — it rose because agents weren’t drained.
Trust Is Emotional, Not Just Measurable
A final human story: after we added a simple disclaimer — “You’re chatting with our AI assistant; tap here for a person anytime” — customers actually trusted the AI more. Our containment rate held steady, but satisfaction comments spiked. It showed me that trust isn’t about perfect accuracy; it’s about honesty and choice.
👉 Why this matters: Metrics like CSAT and NPS are vital, but the human side — empathy, trust, and team morale — is what makes those numbers sustainable. Ignore it, and even great stats will crumble under pressure.
🚀 My 2025 Playbook: Support Experiments I’m Running Now
I don’t just track benchmarks; I run experiments. Some flop, some win, but every test helps me sharpen how we use AI, humans, and process together. Here are four I’m running this year:
1. AI-Guided Macros
Instead of agents digging through old tickets, our copilot suggests three “next best canned replies” drafted from our knowledge base. Agents edit and send. In pilots, this cut first-response time by 40% without dropping tone quality. What I’m still testing: whether this holds at scale without creating “cookie cutter” answers.
2. Transparency Microcopy
We A/B tested two bot openings:
- Version A: “Hi, I’m your support assistant!”
- Version B: “Hi, I’m our AI assistant 🤖. You can ask me anything, or tap to chat with a human.”
Version B had lower abandon rates and higher satisfaction — even when the AI gave the same answers. The transparency + emoji combo humanized the interaction.
3. Embedded Answer Cards
Instead of sending people to a help center, we placed a “mini-card” with the answer right under the form they were stuck on. For example, on the login page: “Forgot your password? Here’s how to reset it.” This tiny change dropped password-related tickets by 28% in a month.
4. Proactive Outreach Experiments
We tested proactive messages like “We noticed your payment failed — want to fix it now?” instead of waiting for customers to contact us. Early numbers show fewer escalations later. The risk? Annoying people. So we limit proactive nudges to high-stakes cases only (payments, order fulfillment).
👉 Why this matters: Stats tell me what’s trending; experiments tell me what works for my org. By testing AI macros, trust microcopy, and in-context help, I learn faster than if I just follow benchmarks blindly.
Conclusion: What Customers Really Want in 2025 (My Take)
From everything I’ve shipped, tested, and measured, one truth stands out: customers crave certainty. They want to feel that you know who they are, you understand their problem, and you’ll solve it without forcing them to start from scratch.The surest way to deliver that is through consistent first-contact resolution, clean bot-to-human handoffs, and embedded answers that feel both personal and trustworthy.
AI plays a powerful role here, not as a replacement, but as an amplifier. When it equips support teams with context, summaries, and suggested next steps, it reduces friction instead of creating it. When it hides behind canned replies, it erodes trust. The difference shows up fast in the metrics: track post-handover FCR, re-contact rates, and SLA reliability, and you’ll see a clear pattern emerge. CSAT goes up, cost-to-serve goes down, and both your customers and your bottom line win.
That’s the balance I’m betting on this year: human support elevated by AI, not buried beneath it. If you’re building your own support strategy, start with certainty as the north star, then use the right tools and measures to make it real.
👉 Want to see how leading teams are doing it? Dive into the benchmarks and stats in this report, and apply the ones that fit your context. The sooner you align your metrics with what customers really care about, the sooner you’ll see the payoff.
Frequently Asked Questions (FAQ)
1) How many stats do I need to set realistic SLAs?
I triangulate immediacy (72%), in-channel resolution value (64%), and internal effective FCR—that trio sets reasonable targets without gaming AHT.
2) What’s a good containment rate in 2025?
On mature intents with tuned KB and routing, 35–55% without CSAT harm is realistic (directional, from my LiveChatAI benchmarks). Too high + rising re-contact = a red flag. (LiveChatAI internal data, 2025)
3) When should I not deploy a bot?
Safety-critical, regulatory, or high-empathy cases should start human-first—use AI to triage/summarize and assist the agent.
4) How do I measure handover quality properly?
Score context completeness + suggested action + sentiment and validate by post-handover FCR. Require AI summaries on attach (I’ve seen +12–18% PH-FCR).
5) What’s the simplest way to prove ROI to finance?
Show before/after on FRT, time-per-issue, PH-FCR, re-contact, cost-to-serve, then anchor investments with market signals (self-service and AI-for-service growth).


