.png)
.png)
.png)

Line Graph Maker AI


.png)
.png)
Trusted by +2K businesses


What is Line Graph Maker AI?
Line Graph Maker AI visualizes data and its progression as time changes.
The aim of Line Graph Maker AI is to create visualized and descriptive charts. That’s how statistics will be available on the chart all the time.
You might need line charts for different reasons, such as showing:
- Seasonal changes
- Impactful trends
- Sudden increase or decrease in rates
- Continuous time intervals
- Performance evaluation
- Multiple variables comparison
Although creating a line chart by entering the values and categories one by one can be exhausting, all you need to do is provide data.
When you enter data as it is supposed to be, Line Graph Maker AI will create the most practical line chart in the fastest way possible.
How Line Graph Maker AI Works?
Line Graph Maker AI can be one of the easiest AI tools you have ever used because the steps are pretty straightforward.
First, you need to prepare your content to enter into the Content box. It can be related to any statistics about any topic.
There are two ways to go about creating a chart for content:
- You can copy part of the content from an article or a related piece.
- Or you can simply write down your statistics and values in the Content box.

P.S: The sample content is taken from Popupsmart’s article “SaaS Growth Metrics & Statistics to Grow Your Business.”
Whether you paste the content or write down all of them, it is totally up to you.
As a significant reminder, you should be specific and explanatory with the prompt that you enter into the Content box.
Lastly, you need to click the button “Generate Line Chart with AI.”
The Result
Here it is!
Your line chart is prepared in seconds without wasting your time.

The first image on the page is your chart when you publish it on a blog page, website, statistical content, or any kind of content to exhibit.
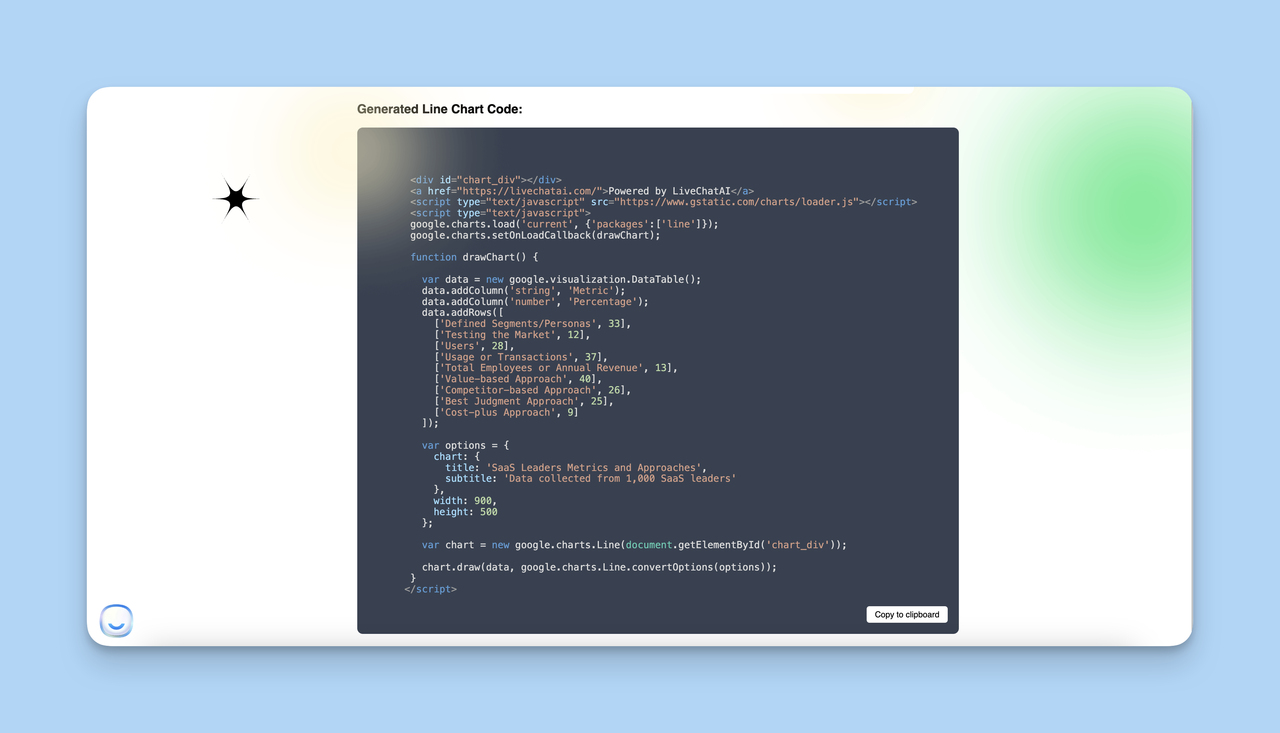
Scrolling down, you will find your AI- generated line chart code to embed into content directly.
As long as you provide the necessary details for Line Graph Maker AI, your line chart will be generated just as you wish.
P.S: If you want to customize your line chart, you can do it by arranging your code on an editor.
.png)
Frequently asked questions

7209 Lancaster Pike Suite 4-1217
Hockessin, DE 19707 USA
help@livechatai.com
